
Map the process before you quote it
An estimate produced before anyone has watched the work happen is a guess with a budget attached.
Read the piece →Everyone in this industry quotes the same statistic. Some version of most software projects fail, and the average one runs wildly over budget. It is repeated in board papers, vendor decks and procurement business cases, usually traced back to the Standish Group's CHAOS report.
Everyone in this industry quotes the same statistic. Some version of most software projects fail, and the average one runs wildly over budget. It is repeated in board papers, vendor decks and procurement business cases, usually traced back to the Standish Group's CHAOS report.
Here is what that report's own chairman, Jim Johnson, wrote when two Dutch researchers challenged his figures: "All data and information in the Chaos reports and all Standish reports should be considered Standish opinion and the reader bears all risk in the use of this opinion."
The researchers, Eveleens and Verhoef at Vrije Universiteit Amsterdam, added a dry note: "We fully support this disclaimer, which to our knowledge was never stated in the Chaos reports." (IEEE Software, 2010)
Their paper is worth understanding, because it is the clearest demonstration we have of how a bad metric corrupts real decisions. Applying Standish's own definitions to their own dataset — 5,457 forecasts across 1,211 real projects — they found an organisation with genuinely excellent, unbiased estimates scored only 35–59% "successful." Meanwhile an organisation whose managers had learned to pad every budget, and whose actual forecasting quality was the worst in the sample, scored 67% "successful." The metric rewarded the padding.
That is the state of the evidence most technology spending decisions rest on.
We think an organisation deciding where to put a serious budget deserves better than that, so this article sets out what the defensible numbers actually say — including the ones that are inconvenient for us.
The strongest study available examined 5,392 IT projects completed between 2002 and 2014, across more than 66 countries, totalling $56.5 billion in spend (2015 prices), with cost data available for 4,677 of them. Published in the Journal of Management Information Systems by Flyvbjerg, Budzier, Lee, Keil, Lunn and Bester.
Their finding is not the one you would expect:
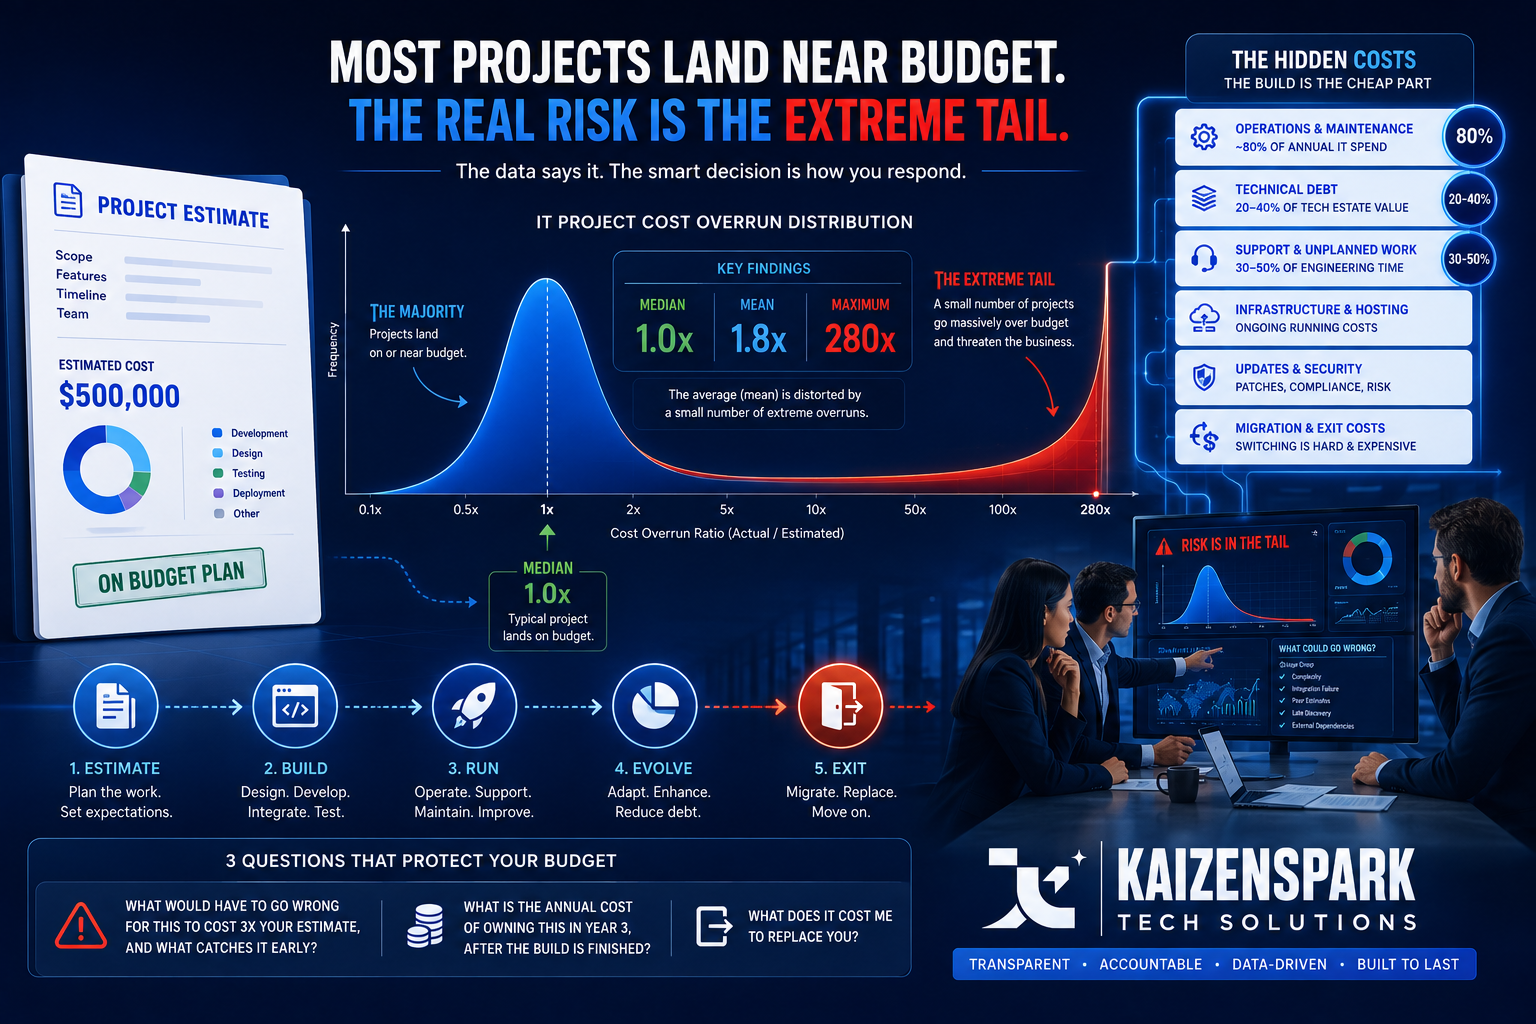
The median cost overrun ratio is 1.0. The typical IT project lands on budget. The mean, however, is 1.8 — and the maximum in the dataset is 280.
The reason those two numbers disagree so violently is that IT project overruns follow a power-law distribution. The authors state it plainly: "the average cost overrun for IT projects does not exist (i.e., cannot be calculated)" and "there is a strong tendency for IT projects to be on budget." (JMIS, 2022; free author version at arXiv)
This changes what a risk conversation should sound like.
If overruns were normally distributed, you could budget a sensible contingency — add 20%, sleep well. They are not. Most projects will be fine. A small number will go so far wrong that they threaten the organisation. Earlier work from the same research lineage, looking at large IT projects (those over $15 million), found that 17% went so badly they threatened the existence of the company, with overruns of 200% to 400%. (McKinsey, 2012 — note this draws on the same underlying database, so treat it as the same evidence viewed differently, not independent corroboration.)
You are not managing an average. You are managing a tail.
And here is the part that surprised us, which we would not have predicted and which changes our own practice: you cannot size your way out of it. The authors tested precisely that. They split the sample by project size and found the differences between the power-law tails were not statistically significant (p = 0.863). They split it by duration and found no significant difference either (p = 0.933). The single largest overrun in the entire dataset — 280 times its estimate — was a $1,500 workflow customisation.
Small projects are not safe projects. They are projects where the catastrophe is smaller in absolute terms, which is a real benefit, but not the one people think they are buying.
So the useful question in a procurement is never "what is your estimate?" It is "what would have to go wrong for this to cost three times your estimate, and what have you built in to catch it early?" If the tail can appear anywhere, early detection is the only defence that generalises.
An honest supplier can answer that. It is the question we would want asked of us.
The second thing that goes wrong in technology budgeting is that the number under discussion is usually the wrong number.
The US Government Accountability Office reports that of the more than $100 billion the federal government spends annually on IT and cyber-related investments, agencies have typically reported spending about 80% on operations and maintenance of existing IT, including legacy systems, rather than on building new ones. That share has risen over time — it was about 75% for fiscal year 2015. (GAO-25-107795, GAO-16-468)
A caveat that matters, and that most people citing this statistic skip: that is a share of an annual budget across a very old portfolio of thousands of systems. It is not the same as saying 80% of a given product's lifetime cost is maintenance.
The often-quoted "60–80% of software lifetime cost is maintenance" figure has a weaker foundation than its popularity suggests — including a drift in the number itself. The most quotable source is Robert Glass in IEEE Software, 2001, and what he actually wrote was: "Maintenance typically consumes about 40 to 80 percent (60 percent average) of software costs." Not 60–80%. It appears in an opinion column that cites no source for the figure and tells readers in its second paragraph "I don't expect you to agree with all these facts." (IEEE Software, 2001, DOI 10.1109/MS.2001.922739)
So: a respected practitioner's considered estimate, restated by others with the floor quietly raised by twenty points. We use 40–80% as a planning range and we say where it comes from.
On where engineering time actually goes, DORA's 2018 State of DevOps research found that even elite-performing teams reported spending only about 50% of their time on new work — the rest going to unplanned work, rework, defects, security remediation and support. Low performers reported 30%. (DORA) This is practitioner self-report, with the same limitations as any survey, and it is now eight years old. We cite it because it is directionally consistent across editions and because nobody has published better.
Read that carefully. The best-run engineering organisations in the world convert half their capacity into new capability. If your business case assumed a team would spend its time building the thing you asked for, the business case was wrong before anyone wrote a line of code.
McKinsey surveyed 50 CIOs at billion-dollar-plus financial services and technology firms and found they estimated technical debt at 20–40% of the value of their entire technology estate before depreciation, with 10–20% of the budget for new products diverted to resolving debt-related issues. Sixty percent said their debt had grown noticeably over three years. (McKinsey, 2020)
Small sample, two sectors, self-estimated — we would not lean a decision on it alone. But it points the same direction as the developers themselves: in Stack Overflow's 2024 survey of over 65,000 developers, technical debt was the number one frustration at work for professional developers, cited by 63% — roughly double the next item on the list. (Stack Overflow, 2024)
The economic point is simple. Debt is not a moral failing or a code-quality abstraction. It is a standing charge against future capacity, and it compounds. Every quarter you defer it, the amount of your budget that buys new capability shrinks. Organisations rarely notice this as a cost. They notice it as their engineering team mysteriously getting slower.
Part of costing a project honestly is knowing which of the numbers in the room are real. These three are not.
"Downtime costs $5,600 per minute." This traces to a single Gartner analyst blog post by Andrew Lerner, dated 16 July 2014. It has no published methodology, sample or survey instrument, and the original page no longer resolves — only third-party quotation and archived copies remain. Gartner's own later research is close to a disavowal, describing infrastructure and operations leaders as often on "a misguided mission to find mythical cost-of-downtime numbers" (Gartner, Why Business Leaders Don't Care About the Cost of Downtime, doc. 3906730, April 2019 — paywalled, and its URL now redirects too, which we note in fairness). If you need a defensible figure, the Uptime Institute's 2026 outage analysis reports that 57% of respondents to its 2025 survey said their most recent major outage cost more than $100,000, and one in five reported more than $1 million — self-reported bands from data centre and IT operators, but with a stated method and a named population. (Uptime Institute)
"A defect costs 100x more to fix in production." Usually attributed to NIST. NIST's 2002 report reproduces that table from other people's work — Boehm (1976) and Baziuk (1995) — and labels its own version "(Example Only)." (NIST Planning Report 02-3) The largest modern test of the idea, across 171 software projects between 2006 and 2014, concluded: "We found no evidence for the delayed issue effect… DIE might be an historical relic that occurs intermittently only in certain kinds of projects." (Menzies, Nichols, Shull & Layman, Empirical Software Engineering, 2017; free version at arXiv) Note what they did not say: that the effect is imaginary. They said it is not universal — which is enough to stop it being a premise.
Any post-2009 CHAOS success rate. The figures sit behind a paid subscription with no published methodology, and the peer-reviewed critique above stands unrebutted on its merits.
We flag these because we have seen all three used to justify budgets, and because a supplier who will repeat a convenient statistic without checking it will do the same with an estimate.
Switching cost is real, large, and almost never modelled at the point of purchase.
The UK Competition and Markets Authority spent nearly two years investigating the cloud services market and concluded on 31 July 2025 that "competition is not working well." Its most striking finding, verbatim: "less than 1% of customers switch provider each year." The CMA named egress fees — charges to move your own data out — as "a key commercial barrier," and found that the technical and commercial barriers together "lock customers into their initial choice of provider." By way of illustration, it noted that if prices sat just 5% above the level of a well-functioning market, UK customers would be paying around £500 million more per year. (CMA final decision, July 2025)
What happened next is instructive about how slowly this moves. In March 2026 the CMA Board declined to open strategic market status investigations into Microsoft's and Amazon's cloud infrastructure businesses, despite its own inquiry group recommending it. Instead it accepted voluntary commitments from both on egress fees and interoperability, opened a narrower investigation into Microsoft's business software ecosystem, and said it would review progress in six months. (CMA, March 2026)
Europe has taken the harder route. Under Article 29 of the EU Data Act, switching charges are capped at directly-incurred cost and are prohibited entirely from 12 January 2027 (the Regulation itself has applied since 12 September 2025). (Regulation (EU) 2023/2854)
That January 2027 date is a planning date, not just a legal one. If you are architecting anything in the next eighteen months, the cost of exit is about to become a negotiable term rather than a fact of life — but only for buyers who ask.
The same applies to us, and to any supplier you engage. The question to put in the room early is: what does it cost, in money and elapsed weeks, to replace you? If nobody can answer, that is the answer.
We are describing an industry problem, so it is only fair to say what we do about it.
We size against the tail, not the average. Every proposal states what would have to go wrong for the cost to run substantially over, and what checkpoint catches it. If we cannot describe the failure mode, we do not understand the project well enough to price it.
We quote the running cost, not just the build. A number that covers construction and stops there is not a cost — it is the deposit. Support, hosting, updates, dependency maintenance and the eventual migration all get a line.
We prefer short feedback loops to long ones. Not because small projects are safe — the data above says they are not — but because the only defence that works against a risk you cannot predict by size is finding out early. Staged delivery is a detection mechanism, not a safety guarantee, and we describe it that way.
We write the exit into the start. Your data, your repositories, your documentation, in portable formats, on request, without a commercial conversation attached.
What would make this cost three times your estimate, and what catches it early?
What is the annual cost of owning this in year three, after the build is finished?
What does it cost me to replace you?
These are unglamorous questions and they will not make a sales meeting more comfortable. They are also the three that separate a technology budget that holds from one that quietly doubles.
If you are working through a decision like this and want the numbers examined properly before anyone builds anything, [that is a conversation we are glad to have](#).
Kaizen Spark Tech designs and delivers software, AI, automation and digital infrastructure for businesses and institutions. Every statistic in this article is linked to its original published source, except where that source sits behind a paywall — in which case we have said so and given the document reference. Where a widely-quoted figure turned out to be unverifiable, we have said that too, rather than used it. If you find something here we have got wrong, tell us and we will correct it in public.
If you have inherited a system with no documentation and need this produced retrospectively, we do that as a standalone engagement, including for software somebody else built.
An estimate produced before anyone has watched the work happen is a guess with a budget attached.
Read the piece →Three situations where we tell clients to fix the process first and quote for less work.
In reviewBefore you sign with anyone, ask them to describe their handover pack. The quality of the answer tells you what kind of relationship you are entering.